.png)
Nine percent of all U.S. house sales in the first quarter of 2023 were flips, with 72,960 single-family homes and condominiums changing hands. This is the second-highest level this century, down from the all-time high of 9.4 percent in Q1 2022 but up from 8 percent in Q4 2022.
While property flipping activity increased, ATTOM's most recent analysis found mixed patterns for raw profits and profit margins. The analysis found that earnings and returns on investments both rose little between Q4 2022 and Q1 2023, but were still near decade lows.
The Q1 2023 study also revealed that the national average gross profit on flips had grown to $56,000. Still one of the lowest points since the U.S. housing market began recovering in 2012 from the Great Recession of the late 2000s, this value was down 20% from $70,000 in Q1 2022. The average profit for a nationwide flip in Q4 2022 was $53,500, up 4.7% from Q4 2022, according to the research.
According to the numbers, the mean gross profit from a property flip in Q1 2023 was $56,000, which equated to a return on investment (ROI) of 22.5%. As stated in the research, the average margin increased somewhat from Q4 2022's 21.7 percent but remained significantly lower than the 51.5 percent level achieved in the middle of 2020.
The proportion of home flips to total home sales grew from Q4 2022 to Q1 2023 in 74% of U.S. metro regions, according to ATTOM's flipping report for Q1 2023. Most of the gains cited in the report were under two percentage points. (Metro regions were included in the analysis if they had 200,000 residents or more and at least 50 home flips in Q1 2023).
According to the most recent data, the metro areas with the highest rates of home flipping in Q1 2023 were Macon, GA (flips accounted for 16.8% of total home sales), Atlanta, GA (15.3%), Jacksonville, FL (15.2%), Memphis, TN (14.4%), and Clarksville, TN (14.3%).
According to ATTOM's most recent research, home flipping accounted for at least 10% of all sales in 36% of the U.S. counties studied in Q1 2023. The analysis found the number to be significantly higher than the predicted 21 percent for Q4 2022. The counties with the highest home flipping rates in Q1 2023 were Baker County, FL (outside Jacksonville; 22.7%), Cobb County (Marietta; 21.5%), Douglas County, GA (outside Atlanta; 21%), Cannon County, TN (east of Nashville; 19.2%), and Paulding County, GA (outside Marietta; 19.2%).
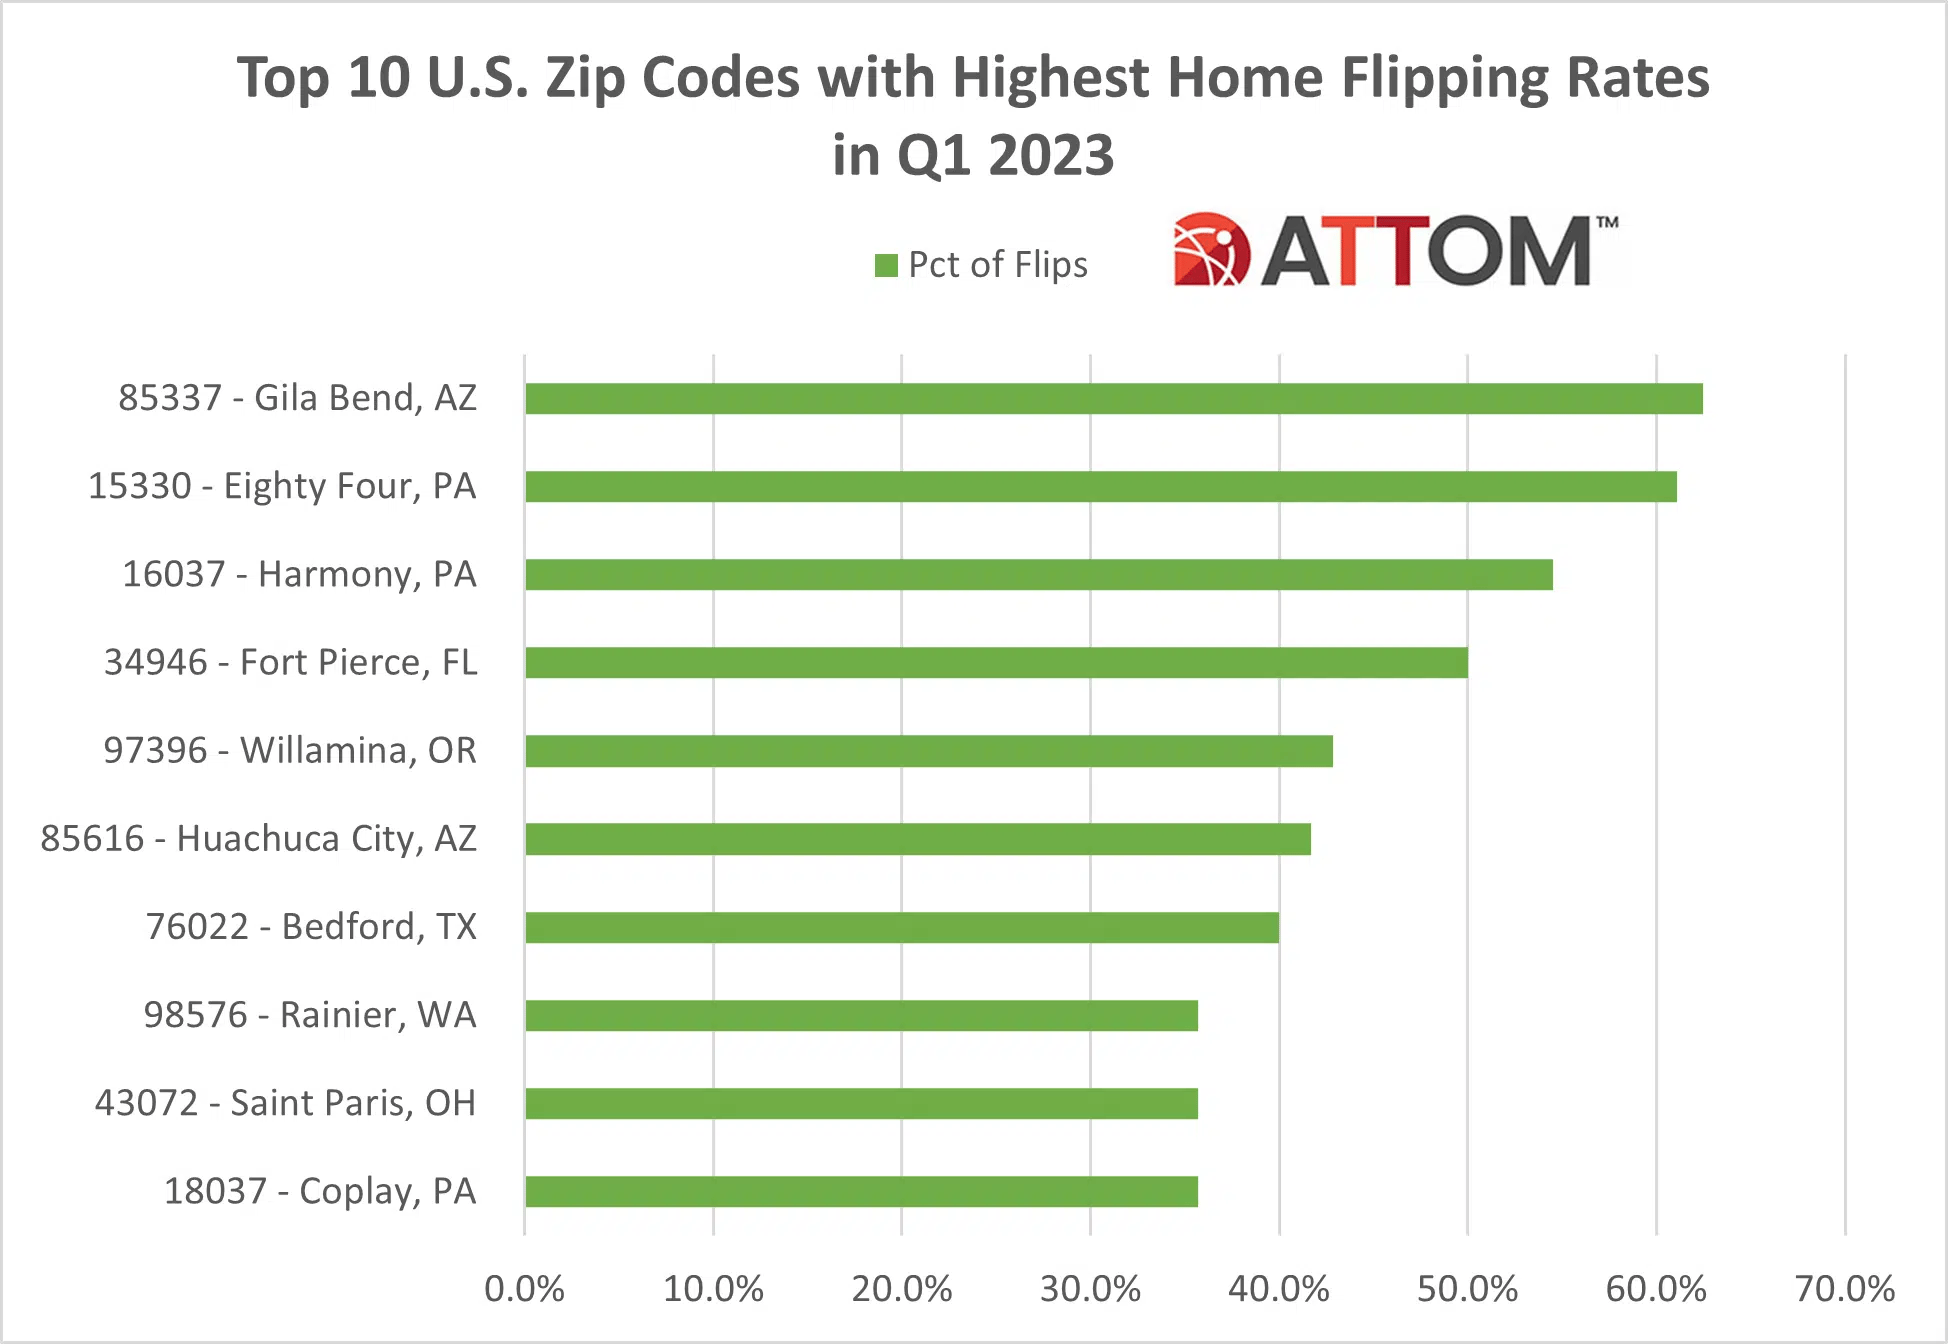
In this article, we analyze the numbers behind ATTOM's newest U.S. Home Flipping Report to find the top 10 zip codes in terms of the percentage of homes that were flipped in the first quarter of 2023. In the first quarter, the following ZIP codes had the highest rates of home flipping among those with 5 or more transactions: 85337 in Gila Bend, AZ (62.5 percent), 15330 in Eighty Four, PA (61.1 percent), 16037 in Harmony, PA (54.5 percent), 34946 in Fort Pierce, FL (50.0 percent), 97396 in Willamina, OR (42.9 percent), 85616 in Huachuca City, AZ (41.7 percent), 76022 in Bedford, TX (40.0